
Stop searching for a “universal” laser marking parameter table. Learn how power, frequency, scanning speed, and hatch spacing work together—and build a repeatable method for optimizing your own process.
Introduction: Why Copying Laser Marking Parameters Often Fails
When setting up a laser marking machine, it is common to search for a parameter table for a specific material and copy the recommended power, speed, frequency, and hatch settings.
Sometimes it works.
Often, it does not.
The reason is simple: laser marking parameters are not universal.
The same parameter set can produce completely different results when you change the laser source, focusing lens, spot size, focal position, material batch, surface condition, or even the marking objective.
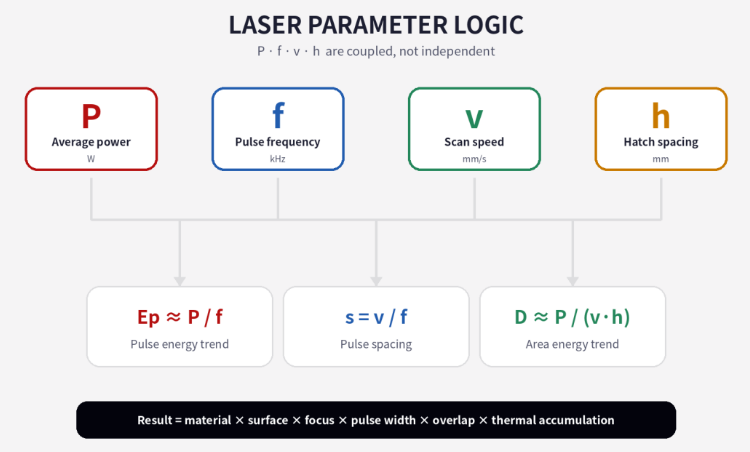
Power, frequency, speed, and hatch spacing are also not four independent controls. Together, they determine pulse energy, pulse spacing, energy distribution, heat accumulation, surface coverage, and processing time.
The real goal is therefore not to find one “perfect” parameter.
It is to find a stable process window.
1. What Do Power, Frequency, Speed and Hatch Spacing Really Control?
The software interface may show four simple parameters:
- Laser Power
- Pulse Frequency
- Scanning Speed
- Hatch Spacing
But the material does not respond directly to these numbers.
It responds to physical effects such as:
- Pulse energy
- Pulse overlap
- Energy density
- Line energy
- Area energy input
- Thermal accumulation
- Spot size
- Heat diffusion
Understanding these relationships makes laser parameter optimization much easier.
2. Laser Power: The Average Energy Delivery Level
Laser power determines the average energy delivered by the laser system.
Increasing power generally increases the amount of energy available for marking, which can increase contrast, material removal, or engraving depth.
However, higher power does not automatically mean deeper or better marking.
For example, a 20 W fiber laser operating at 50% power and a 50 W fiber laser operating at 50% power are obviously not delivering the same optical power.
Even two lasers with the same rated power can behave differently because of differences in pulse characteristics, frequency response, beam quality, and optical configuration.
When should you consider increasing power?
If the marking is too light or material removal is insufficient, increasing power can be one possible solution.
However, first check:
- Is the laser properly focused?
- Is the frequency appropriate?
- Is the scanning speed too high?
- Is the hatch spacing too large?
- Is the laser wavelength suitable for the material?
Increasing power should not be the first response to every weak marking result.
Signs that power may be too high
Watch for:
- Melted or rounded edges
- Excessive burrs
- Surface deformation
- Plastic bubbling or carbonization
- Excessive heat-affected areas
- Heavy recast or slag during deep engraving
The correct power is therefore not simply “maximum power.”
It is the power level that provides sufficient material interaction while maintaining the required surface quality.
3. Frequency: More Pulses Does Not Always Mean More Energy Per Pulse
Pulse frequency, normally expressed in kHz, determines how many laser pulses are generated per second.
One of the most important concepts is the relationship between average power and pulse energy.
For a pulsed laser operating within a suitable range, a useful engineering approximation is:
Pulse Energy ≈ Average Power ÷ Pulse Frequency
This means that, when average power remains approximately constant:
Higher frequency → more pulses → lower energy per pulse
Lower frequency → fewer pulses → higher energy per pulse
However, this should be treated as an engineering approximation rather than a universal rule. Actual laser output power, pulse width, pulse shape, and pulse energy can change with frequency depending on the laser source.
This is particularly important when working with MOPA fiber lasers, where pulse width can provide another important control over the laser-material interaction.
Lower frequency
Lower frequency can provide higher energy per pulse under suitable operating conditions.
This may be useful when stronger individual pulse interaction or material removal is required.
Higher frequency
Higher frequency can produce more closely spaced pulses and may help create smoother or more uniform surface effects.
But again:
High frequency does not automatically mean finer marking.
Frequency must always be considered together with scanning speed, pulse width, spot size, and average power.
4. Scanning Speed: How Closely the Pulses Are Distributed Along the Path
Scanning speed determines how quickly the laser beam moves across the workpiece.
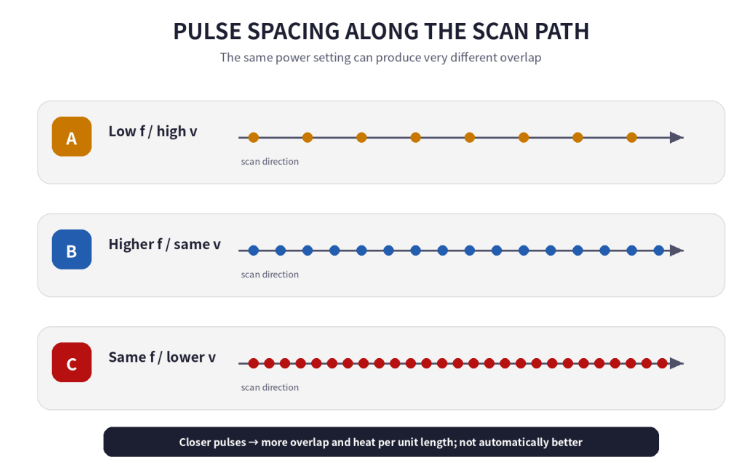
If the scanning speed increases while other conditions remain unchanged, fewer pulses are delivered to each unit length.
If the speed decreases, more pulses are delivered to the same area and thermal accumulation can increase.
A useful approximation is:
Pulse Spacing = Scanning Speed ÷ Pulse Frequency
For example, increasing scanning speed increases the distance between consecutive pulses.
Increasing frequency decreases the distance between consecutive pulses.
This relationship is one of the most useful tools for understanding pulse overlap. Pulse spacing should also be compared with the actual focused spot diameter.
Why extremely low speed is not always better
Slowing down the laser can increase energy input, but eventually excessive heat can cause:
- Thermal discoloration
- Melting
- Burr formation
- Recast material
- Plastic deformation
- Excessive heat-affected zones
For deep engraving, multiple passes at a controlled speed can sometimes provide a better process than attempting to remove all material in a single, extremely slow pass.
5. Hatch Spacing: Controlling Area Coverage
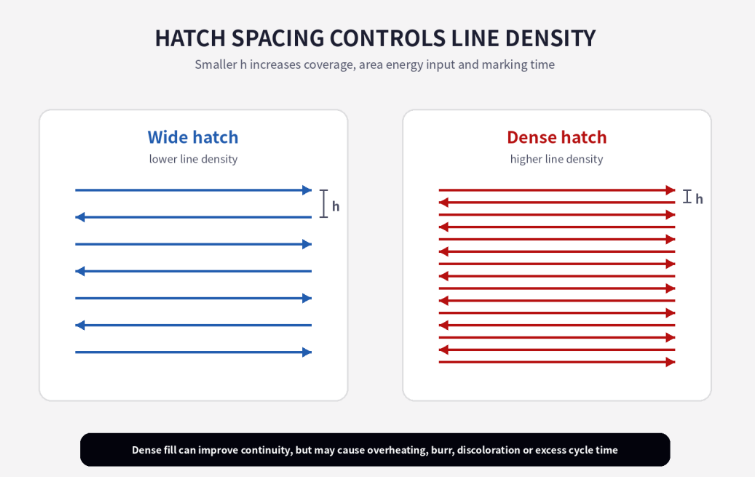
Hatch spacing, or fill spacing, is the distance between adjacent scanning lines.
It determines how densely the laser covers a filled area.
Smaller hatch spacing
A smaller hatch spacing means:
- More scanning lines
- Higher coverage density
- Higher average energy input per area
- Longer processing time
- Greater potential for thermal accumulation
Larger hatch spacing
A larger hatch spacing means:
- Fewer scanning lines
- Shorter processing time
- Lower area energy input
- Higher risk of visible line patterns or uncovered areas
A simplified relationship for comparing area energy input is:
Relative Area Energy ≈ Average Power ÷ (Scanning Speed × Hatch Spacing) × Number of Passes
This is an engineering approximation rather than a complete physical model. It does not include material absorption, spot profile, pulse width, heat diffusion, or other process variables.
The important point is that hatch spacing is not simply a “fineness” setting.
It directly affects both process time and energy distribution across the marked area.
6. Pulse Overlap: The Missing Concept in Many Parameter Tables
A parameter table may tell you:
Power = 70%
Frequency = 50 kHz
Speed = 1000 mm/s
But these numbers alone do not tell you how the pulses interact on the surface.
Pulse spacing can be estimated as:
Pulse Spacing = Speed ÷ Frequency
Pulse overlap can then be related to the effective spot diameter.
For a simplified circular spot:
Pulse Overlap ≈ 1 − (Pulse Spacing ÷ Spot Diameter)
This means that pulse overlap depends not only on frequency, but also on:
- Scanning speed
- Frequency
- Focused spot size
- Beam quality
- Focusing optics
This is one reason why the same frequency and speed can behave differently when a different focusing lens is installed.
7. Why the Focusing Lens Can Change Everything
The field lens is often overlooked when copying laser marking parameters.
A different lens can change:
- Marking field size
- Focused spot size
- Energy density
- Depth of focus
- Resolution
- Processing efficiency
A larger marking field may use a different optical configuration and produce a larger focused spot.
As the spot size changes, the same laser power is distributed over a different area.
Therefore:
Same laser + same power + same frequency + same speed ≠ necessarily the same marking result.
Focus position is equally important.
A defocused beam generally produces a larger spot and lower energy density at the workpiece.
That is why the first step in parameter optimization should always be to establish a stable optical condition before changing process parameters.
8. Do Not Adjust Four Parameters at the Same Time
One of the most common mistakes in laser parameter testing is changing power, speed, frequency, and hatch spacing simultaneously.
If the result improves, you do not know why.
If the result becomes worse, you also do not know which change caused it.
A better approach is to use a parameter matrix.
Step 1: Fix the Basic Conditions
Before testing, record:
- Laser source and model
- Rated power
- Wavelength
- Pulse width
- Frequency range
- Focusing lens
- Spot size if available
- Focal position
- Material grade
- Material surface condition
- Marking size
- Hatch mode
- Number of passes
- Exhaust conditions
This creates a reproducible process baseline.
Step 2: Start With a Power × Speed Matrix
Keep frequency and hatch spacing fixed.
Test several power levels against several scanning speeds.
The purpose is not to immediately find the perfect setting.
First identify:
No effective marking → usable process window → excessive thermal damage
This gives you a practical operating range.
Step 3: Optimize Frequency
Once the usable power-speed window is identified, compare different frequencies.
Observe:
- Marking contrast
- Surface roughness
- Material removal
- Edge quality
- Thermal effects
- Consistency
For MOPA fiber lasers, record pulse width together with frequency because the two parameters can interact strongly with the material response.
Step 4: Optimize Hatch Spacing and Fill Strategy
After the main energy window is established, optimize:
- Hatch spacing
- Fill direction
- Cross-hatching
- Number of passes
The objective is not to make hatch spacing as small as possible.
The objective is to achieve:
Good coverage + acceptable surface quality + reasonable cycle time
9. Common Laser Marking Problems and What to Check
The Mark Is Too Light
Check:
- Focus position
- Material absorption
- Laser wavelength
- Power
- Scanning speed
- Frequency
- Hatch spacing
Do not immediately increase every parameter.
The Edges Are Blurred or Overheated
Possible causes include excessive energy input or thermal accumulation.
Try evaluating:
- Higher scanning speed
- Lower power
- Larger hatch spacing
- Fewer passes
- Different frequency
- Different pulse width
Also check focus and exhaust conditions.
The Surface Is Rough or Has Strong Dots
Possible causes include excessive single-pulse interaction or insufficient pulse overlap.
Depending on the laser source, you may test:
- Higher frequency
- Higher scanning speed
- Lower power
- Different pulse width
Then optimize hatch spacing to restore sufficient area coverage.
Visible Lines or Unfilled Areas
Check:
- Hatch spacing
- Fill direction
- Cross-hatching
- Focus consistency
- Beam quality
- Field lens
Simply reducing scanning speed may increase the energy of each line without solving the gap between lines.
Deep Engraving Becomes Increasingly Inefficient
Check:
- Material removal and debris
- Smoke extraction
- Recast layer
- Focus position
- Hatch direction
- Number of passes
For deep engraving, a multi-pass strategy can sometimes provide better control than one extremely slow pass.
10. Why the Same Parameter Set Fails on Another Machine
This is perhaps the most important lesson.
A laser marking parameter should never be recorded as only:
Power: 80%
Speed: 1000 mm/s
Frequency: 30 kHz
Hatch: 0.03 mm
That information is incomplete.
A reproducible process record should also include:
Laser source + optical configuration + lens + focus + pulse width + material + marking objective + hatch strategy
Other factors can also influence the result, including:
- Beam quality
- Spot size
- Material absorption
- Surface roughness
- Material batch
- Scanner dynamics
- Control-card delays
- Environmental temperature
- Smoke extraction
- Workpiece flatness
This is why a parameter table copied from another machine should be treated as a starting point—not a production recipe.
11. A Practical Laser Parameter Optimization Workflow
A simple workflow is:
Step 1 → Select the correct laser technology
↓
Step 2 → Establish correct focus and optical configuration
↓
Step 3 → Find the usable Power × Speed window
↓
Step 4 → Optimize Frequency and Pulse Width
↓
Step 5 → Optimize Hatch Spacing and Fill Direction
↓
Step 6 → Compare Single-Pass vs Multi-Pass Processing
↓
Step 7 → Validate on real production parts
↓
Step 8 → Confirm process stability and cycle time
The final production parameter should not simply be the setting that produces the best-looking sample.
It should be the setting that remains stable despite reasonable variations in:
- Focus
- Material
- Temperature
- Machine condition
- Production cycle
- Operator operation
12. The Key Principles to Remember
If you only remember a few things from this article, remember these:
1. Power is not a “depth knob”
Power controls average energy delivery, but the result depends on the entire process.
2. Frequency is not simply a “quality knob”
Frequency changes pulse density and, depending on the laser source, can also affect pulse energy and pulse characteristics.
3. Speed controls energy distribution along the scan path
Faster speed generally means fewer pulses per unit length.
4. Hatch spacing controls area coverage
Smaller spacing increases coverage density but also increases processing time and potential heat accumulation.
5. Pulse overlap matters
Frequency and speed should always be considered together with spot size.
6. Focus and optics matter
A different field lens or focal condition can make the same parameter set behave completely differently.
7. Parameter matrices are better than parameter tables
The goal is not to memorize numbers.
The goal is to understand why the numbers work.
Conclusion: Stop Looking for the “Perfect Parameter”
Laser marking optimization is not about finding one universal combination of power, frequency, speed, and hatch spacing.
It is about understanding how these parameters distribute energy over the material.
In simple terms:
Power + Frequency → Pulse Energy
Speed + Frequency → Pulse Spacing
Spot Size + Pulse Spacing → Pulse Overlap
Speed + Hatch Spacing + Power → Area Energy Input
Then add:
Pulse Width + Focus + Beam Quality + Material Properties + Thermal Diffusion
And you begin to understand the real process window.
The most valuable parameter table is therefore not a list of numbers.
It is a record of machine conditions, material conditions, test methodology, and the logic behind the final settings.
That is what makes laser marking parameters repeatable, transferable, and useful for production.
Looking for the Right Laser Marking Solution?
At CS Tec, we work with fiber, UV, CO₂ and other laser technologies for different marking and material processing requirements.
If you are testing a new material or developing a new marking process, send us your material, desired marking effect, laser type, and application requirements.
Our team can help evaluate the appropriate laser source and develop a practical parameter testing strategy for your application.
CS Tec — Laser Technology & Application Solutions