
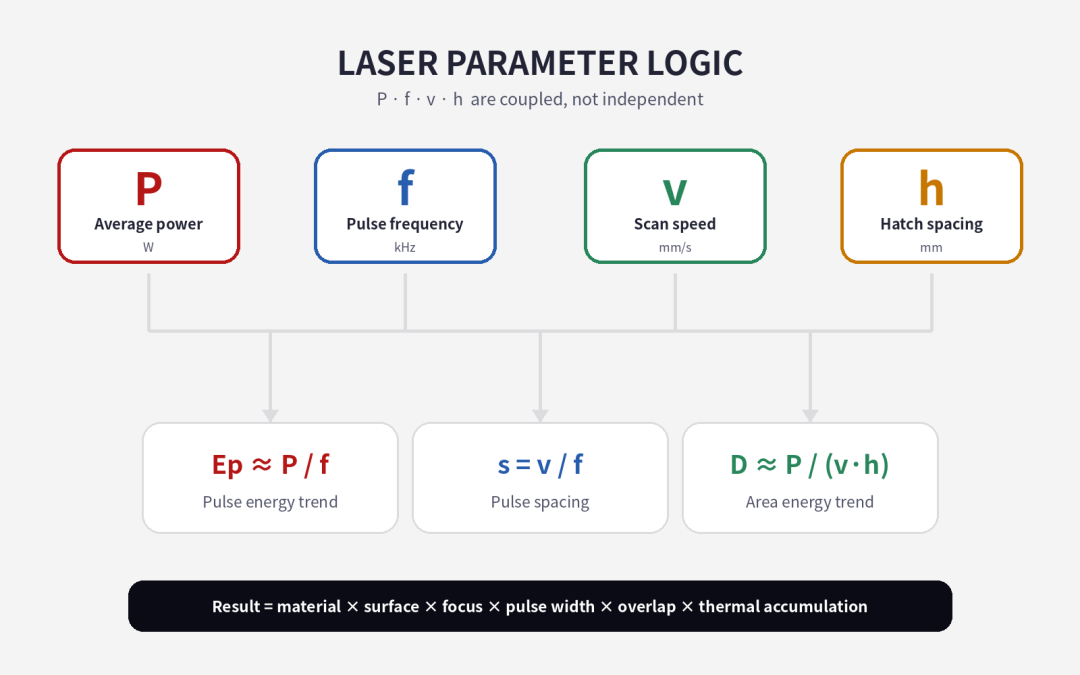
Core takeaway: Fiber laser marking parameters should not be adjusted one at a time as if power, frequency, speed, and hatch spacing were independent controls. They work together to determine how much energy each pulse carries, how closely pulses overlap along the scan path, and how much energy is delivered across the marked area.
A useful way to think about laser marking is through three relationships:
- Pulse energy ≈ average power ÷ pulse frequency
- Pulse spacing along the scan path ≈ marking speed ÷ pulse frequency
- Approximate area energy input ≈ average power ÷ (marking speed × hatch spacing)
These relationships are not universal process formulas, but they provide a much better starting point than copying parameter recipes from another machine.
When configuring an industrial fiber laser source for marking, the most important question is not “What power percentage should I use?” It is “What laser-material interaction am I trying to create, and which combination of pulse energy, overlap, and heat accumulation will produce it?”
Why Do Copied Laser Marking Parameters Often Fail?
Laser marking recipes are often shared as a simple group of numbers:
- Power: 70%
- Frequency: 50 kHz
- Speed: 1000 mm/s
- Hatch spacing: 0.03 mm
The problem is that these values have meaning only inside a specific laser system.
The same settings can produce a different result when any of the following changes:
- Laser source type
- Q-switched vs MOPA architecture
- Available average power
- Pulse duration
- Beam quality
- Spot diameter
- F-theta lens focal length
- Working distance
- Material alloy or formulation
- Surface coating or oxidation
- Scanner calibration
This is why parameter recipes should be treated as starting points rather than production specifications.
What Do Power, Frequency, Speed, and Hatch Spacing Actually Control?
The four main marking parameters influence different parts of the energy-delivery process, but their effects overlap.
| Parameter | What it directly changes | What it indirectly affects |
|---|---|---|
| Power | Average optical energy available | Line energy, area energy, thermal load |
| Frequency | Number of laser pulses per second | Pulse energy, pulse spacing, overlap |
| Speed | How fast the beam moves across the material | Pulse spacing, dwell time, line energy |
| Hatch spacing | Distance between adjacent fill lines | Area energy density, thermal accumulation, marking time |
The important point is that changing one parameter usually changes more than one physical quantity.
How Does Laser Power Affect Marking?
Laser power controls the average optical energy available to the process, but it should not be treated as a simple “temperature” control. The actual material response still depends on frequency, speed, spot size, pulse duration, and absorption.
If all other parameters remain unchanged, increasing average power generally increases the amount of energy delivered per unit length and per unit area.
This can produce:
- Deeper engraving
- Stronger ablation
- Darker thermal marking
- Greater coating removal
- More melting or oxidation
But too much energy can also produce:
- Rough surfaces
- Excessive melting
- Large burrs
- Material warping
- Burned plastics
- Loss of fine detail
Higher power is therefore useful only when the process can use the additional energy effectively.
Does 50% Power Mean Half of the Rated Laser Power?
Not necessarily. A software power percentage represents a command to the laser system, but the relationship between command percentage and actual optical output depends on the source architecture and operating conditions.
Some sources also have minimum operating thresholds or power-frequency combinations where the actual output does not scale perfectly linearly.
For process development, measured or manufacturer-characterized output is more meaningful than assuming that every percentage corresponds exactly to the same percentage of rated wattage.
How Does Frequency Affect Fiber Laser Marking?
Frequency defines how many laser pulses are emitted each second. Changing frequency affects both the temporal density of pulses and, in many pulsed sources, the energy available in each individual pulse.
Why Does Lower Frequency Often Increase Pulse Energy?
For a simplified pulsed system operating at approximately constant average power:
Pulse energy ≈ average power ÷ repetition frequency
This means that if average power remains similar, reducing frequency distributes the available energy across fewer pulses.
For example, the conceptual relationship is:
| Frequency change | Number of pulses | Typical pulse-energy tendency |
|---|---|---|
| Lower frequency | Fewer pulses per second | Higher energy per pulse |
| Higher frequency | More pulses per second | Lower energy per pulse |
This relationship is useful for understanding the process, but it should not be treated as an exact prediction for every fiber laser source. Actual pulse-energy behavior depends on the source design and operating range.
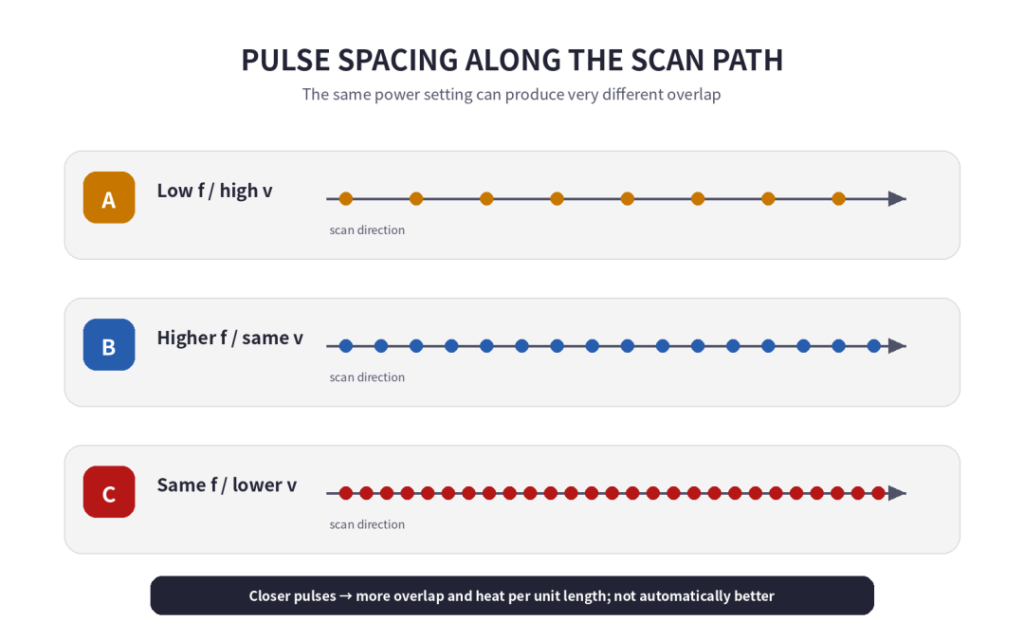
How Does Frequency Affect Pulse Spacing?
Frequency also determines how closely consecutive pulses land along the scanning direction.
A useful approximation is:
Pulse spacing = marking speed ÷ pulse frequency
Consider three cases at the same marking speed:
- Low frequency: pulses are farther apart
- Medium frequency: pulse spacing becomes smaller
- High frequency: pulses overlap more strongly
If the pulse spacing becomes too large relative to the laser spot, the marked line can develop visible dots or an inconsistent texture.
If overlap becomes excessive, thermal accumulation can increase even when individual pulse energy becomes lower.
How Does Marking Speed Affect the Result?
Marking speed controls how quickly the laser spot travels across the workpiece. It affects both how much energy is delivered along each millimeter of the scan path and how many pulses overlap in that distance.
Why Does Slower Speed Usually Create a Stronger Mark?
At constant average power, a useful approximation for line energy is:
Line energy ≈ laser power ÷ marking speed
Reducing speed therefore increases the optical energy delivered along each millimeter of the scan path.
This can increase:
- Engraving depth
- Surface heating
- Oxidation
- Material removal
- Marking contrast
However, slower is not automatically better. Excessive line energy can create melting, roughness, discoloration, or distortion.
How Does Speed Interact With Frequency?
Speed and frequency jointly determine pulse spacing.
If frequency remains constant:
- Higher speed spreads pulses farther apart
- Lower speed places pulses closer together
This means that increasing speed without adjusting frequency may eventually create visible pulse separation.
Conversely, slowing the scanner substantially while keeping frequency high can produce heavy pulse overlap and stronger heat accumulation.
What Does Hatch Spacing Do in Laser Marking?
Hatch spacing is the distance between adjacent scan lines used to fill an area. It strongly affects area energy density, surface uniformity, and total marking time.
Why Does Smaller Hatch Spacing Produce a Denser Mark?
When hatch spacing becomes smaller, more scan lines are placed inside the same marked area.
Conceptually:
- Wide hatch spacing: fewer lines, lower area energy, faster marking
- Narrow hatch spacing: more lines, greater overlap, higher area energy, longer marking time
A simplified relationship is:
Approximate area energy input ≈ power ÷ (speed × hatch spacing)
If power and speed remain unchanged, halving hatch spacing approximately doubles the amount of scan-line exposure used to cover the area.
This makes hatch spacing one of the most powerful parameters for changing a filled marking without altering individual pulse behavior.
Can Hatch Spacing Be Too Small?
Yes. Excessively dense hatching can increase thermal accumulation, create rough surfaces, slow production unnecessarily, and produce repeated remelting of material that has already been processed.
The correct spacing should relate to:
- Focused spot diameter
- Track width on the actual material
- Required surface finish
- Desired engraving depth
- Thermal sensitivity
How Do the Four Laser Marking Parameters Work Together?
The fastest way to understand parameter interaction is to stop looking at four isolated numbers and instead think about three physical effects.
| Physical effect | Main relationship | What it influences |
|---|---|---|
| Energy per pulse | Power / frequency | Ablation strength, peak material interaction |
| Pulse overlap along scan | Speed / frequency | Line continuity, heat accumulation, surface texture |
| Energy across filled area | Power / (speed × hatch spacing) | Engraving depth, thermal load, marking density |
These three relationships provide a practical direction for troubleshooting.
If a mark is too weak, the solution is not automatically “increase power.” You may instead need:
- More pulse energy
- More pulse overlap
- More hatch-line density
- Better focus
Each approach can create a different surface result.
How Should You Adjust Parameters for Different Marking Goals?
The desired physical result should determine the direction of adjustment.
| Marking goal | Typical parameter direction to evaluate | Main reason |
|---|---|---|
| Deeper metal engraving | Higher usable power, lower speed, suitable lower frequency, multiple passes | Increase material removal per area |
| Fine surface marking | Moderate power, higher speed, controlled hatch | Limit unnecessary thermal damage |
| Darker thermal marking | Increase controlled heat accumulation | Promote oxidation or surface transformation |
| Reduce melting | Increase speed or reduce area energy | Lower thermal accumulation |
| Improve line continuity | Increase frequency or reduce speed | Reduce spacing between pulses |
| Increase fill density | Reduce hatch spacing | Add more scan lines per area |
| Reduce cycle time | Increase speed or hatch spacing where quality allows | Reduce total scanning time |
These directions are starting points, not production recipes.
What Should You Adjust First When the Marking Result Is Wrong?
Rather than changing every setting at once, start from the visible defect and identify the physical effect most likely responsible.
| Observed problem | Check first | Possible adjustment direction |
|---|---|---|
| Mark is too light | Focus and total energy input | Increase power, reduce speed, or reduce hatch spacing |
| Mark is burned or heavily melted | Area energy and thermal accumulation | Reduce power, increase speed, or widen hatch spacing |
| Individual dots are visible | Pulse spacing | Increase frequency or reduce speed |
| Surface is rough | Pulse energy and repeated remelting | Reduce pulse energy or area exposure |
| Fill lines are visible | Hatch spacing | Reduce spacing or use cross-hatching |
| Marking is uneven across field | Focus, field calibration, optics | Do not assume parameter problem first |
| Color marking is unstable | Pulse duration, focus, thermal window | Use a structured parameter matrix |
| Deep engraving is too slow | Material removal per pass | Optimize pulse energy, speed, and number of passes together |
Why Does the Same Parameter Set Fail on Another Fiber Laser?
Because the numbers shown in marking software do not fully describe the laser-material interaction.
Two systems can both display:
- 50% power
- 60 kHz
- 1000 mm/s
- 0.03 mm hatch
and still produce different marks.
The missing variables can include:
- Actual average output power
- Pulse duration
- Pulse shape
- Peak power
- Maximum pulse energy
- Beam quality
- Focused spot diameter
- Lens focal length
- Source modulation behavior
- Scanner acceleration
- Focus accuracy
Material variation adds another layer. Stainless steel grade, anodized coating thickness, polymer additives, surface roughness, and oxidation can all change the optimum parameter window.
This is why transferring settings between machines should begin with a test matrix rather than blind copying.
Why Is Pulse Width Important on a MOPA Fiber Laser?
On a MOPA source, pulse duration becomes another major process variable. Two markings with the same average power, frequency, speed, and hatch spacing can still behave differently when pulse width changes.
Pulse duration influences peak power because approximately:
Peak power ≈ pulse energy ÷ pulse duration
A shorter pulse can concentrate similar pulse energy into a shorter time interval, increasing peak power and changing how the material responds.
This is why MOPA systems provide greater control for processes such as:
- Black marking
- Color marking
- Heat-sensitive plastics
- Thin coatings
- Fine ablation
- Selective surface modification
Frequency should therefore never be interpreted independently from pulse width on a MOPA source.
How Should You Find the Best Fiber Laser Marking Parameters?
The most reliable method is a structured parameter matrix on the actual production material. Changing one parameter at a time is useful for understanding cause and effect, while a controlled two-variable matrix can locate a usable process window much faster.
A practical workflow is:
- Confirm focus. Do not tune parameters around an incorrect working distance.
- Define the marking target. Contrast, depth, surface finish, color, or coating removal.
- Select a reasonable starting frequency. Use the source’s permitted operating range.
- Run a power-speed matrix. Identify the region that creates the desired basic interaction.
- Refine frequency. Adjust pulse energy and pulse overlap.
- Optimize hatch spacing. Balance fill uniformity, heat accumulation, and cycle time.
- For MOPA sources, optimize pulse duration.
- Evaluate multiple passes where needed.
- Record the final parameters together with the material specification.
Official laser-marking systems use this same general idea: parameter-finding tools typically vary power, speed, and frequency across test matrices because material interaction is multidimensional rather than controlled by one “best setting.”
What Should Be Recorded With a Laser Marking Recipe?
A useful process recipe should contain more than the four numbers visible in the software.
Record:
- Material name and grade
- Surface coating or finish
- Laser source model
- Rated power
- Power setting
- Frequency
- Pulse duration where adjustable
- Marking speed
- Hatch spacing
- Hatch angle
- Number of passes
- Lens focal length
- Focus offset
- Marking objective
This makes the recipe reproducible when the same job returns months later.
For OEM marking systems, the selected fiber laser source should also be matched to the required pulse-energy range, frequency range, pulse-width control, beam quality, and marking-speed target rather than selected from average wattage alone.
What Is the Most Important Rule for Adjusting Fiber Laser Marking Parameters?
Do not ask which single parameter should be increased. Ask which physical quantity needs to change.
If you need stronger ablation, investigate pulse energy.
If you need smoother continuous lines, investigate pulse spacing and overlap.
If you need more or less total heat across a filled area, investigate power, speed, and hatch spacing together.
If identical settings behave differently between machines, investigate pulse width, spot size, beam quality, focus, and source architecture before blaming the material.
The best marking parameter is not a number copied from another machine. It is a repeatable process window built around the interaction between a specific laser source, optical system, and material.
Frequently Asked Questions About Fiber Laser Marking Parameters
Should I Increase Power or Reduce Speed to Make a Deeper Mark?
Either can increase energy delivered to the material, but they do not always create the same physical result. Increasing power changes available optical energy, while reducing speed also changes pulse overlap and thermal accumulation.
Does Higher Frequency Make a Stronger Mark?
Not necessarily. Higher frequency produces more pulses per second and reduces pulse spacing, but pulse energy often decreases when average power is limited. The result depends on the source and material.
What Happens If Hatch Spacing Is Too Small?
Very small hatch spacing increases line overlap, area energy input, and marking time. This may darken or deepen the mark, but it can also create unnecessary heat accumulation and surface roughness.
Can I Use the Same Parameters on Two Fiber Laser Markers With the Same Wattage?
Not reliably. Pulse width, pulse energy, beam quality, lens focal length, spot size, actual output characteristics, and scanner behavior can all differ even when both systems have the same rated average power.